3rd Grade, Activity 339: Represent and Interpret Data
Draw a scaled picture graph and a scaled bar graph to represent a data set with several categories. Solve one- and two-step “how many more” and “how many less” problems using information presented in scaled bar graphs. For example, draw a bar graph in which each square in the bar graph might represent 5 pets.
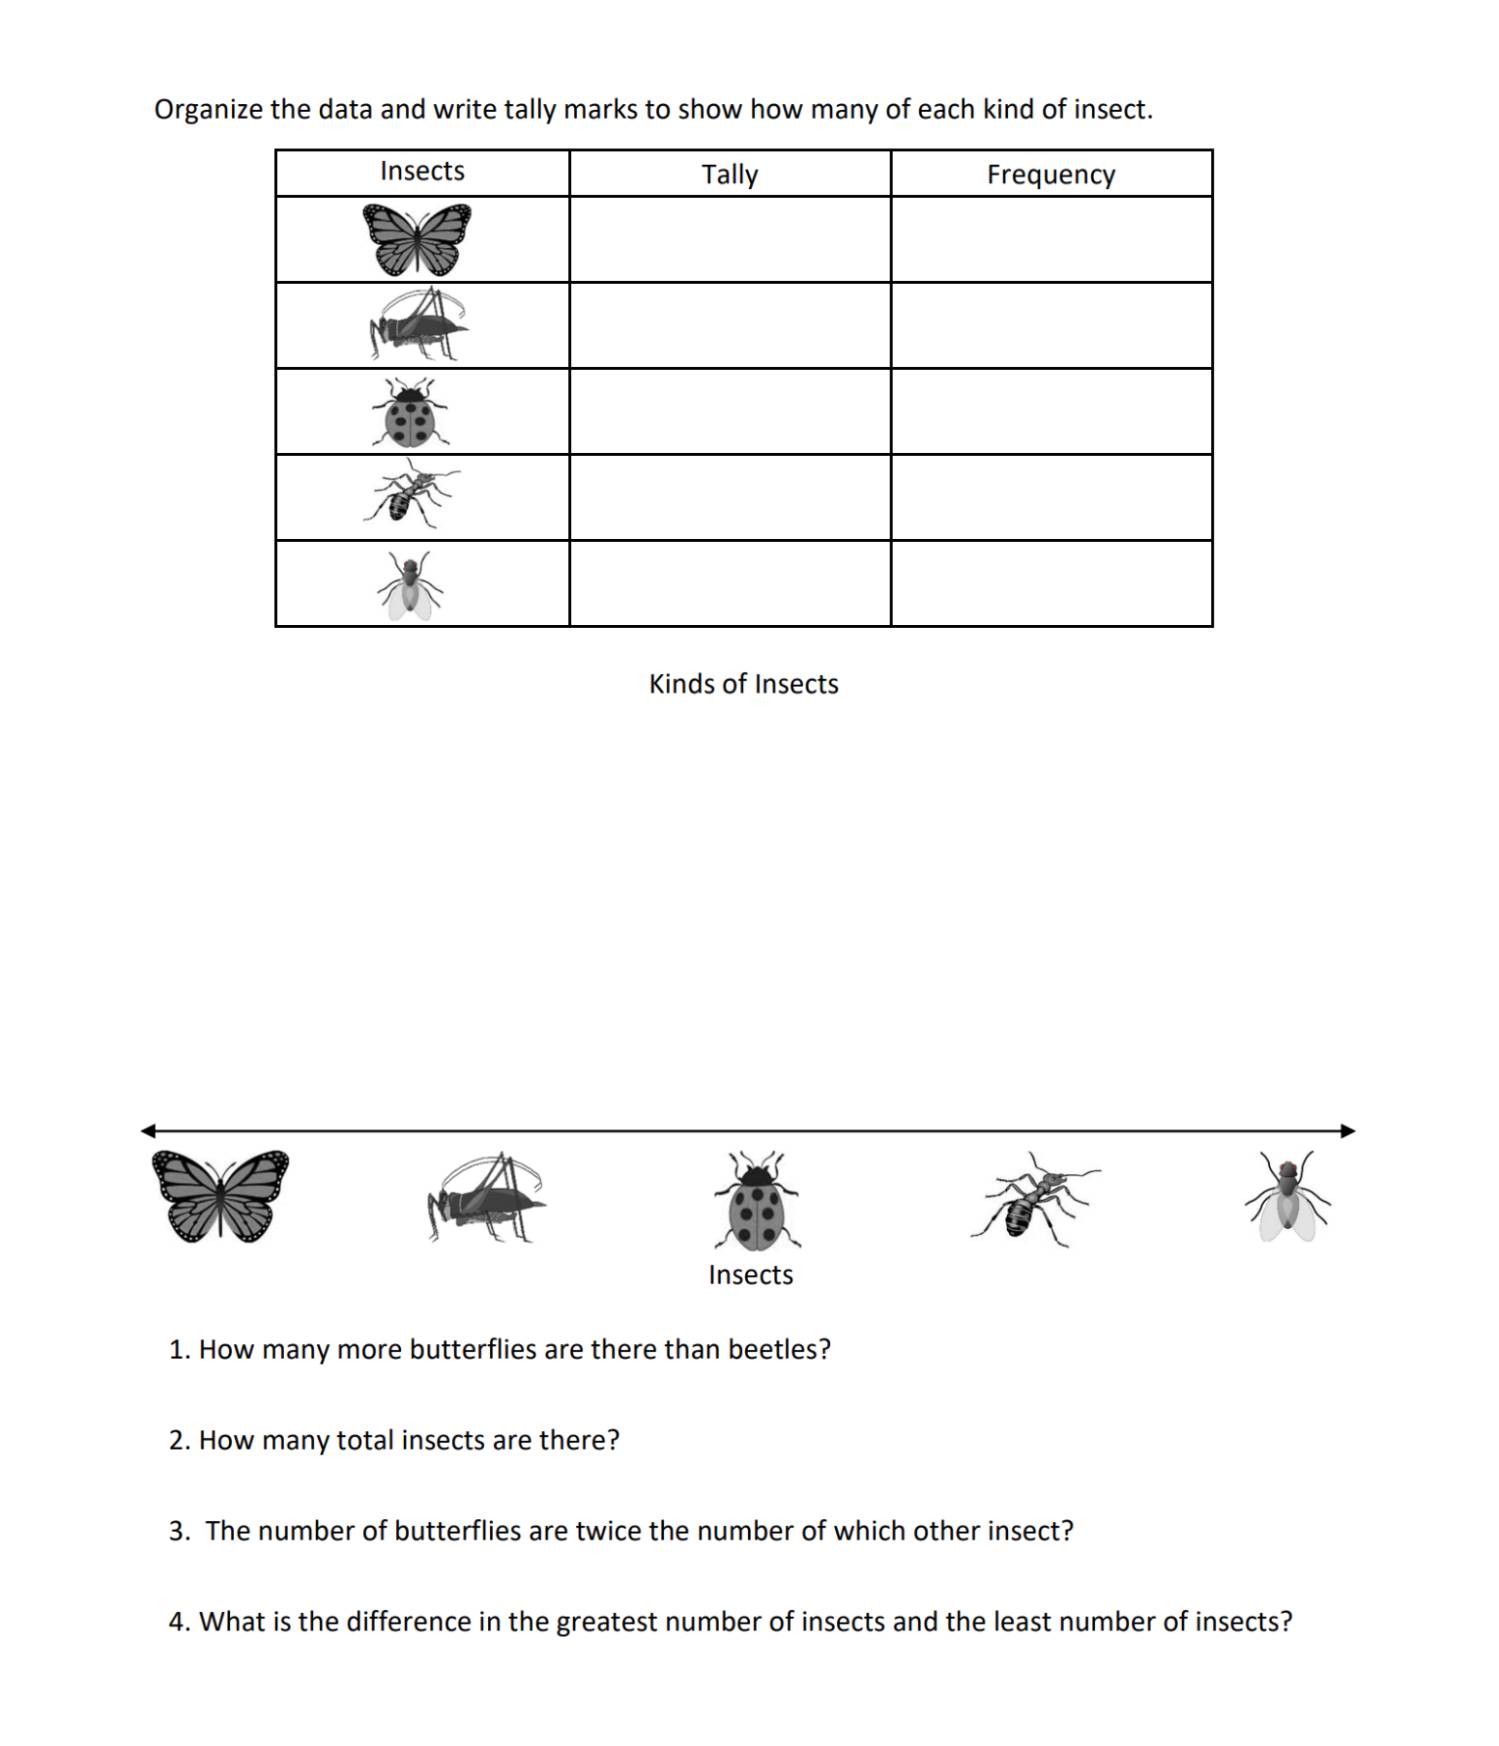
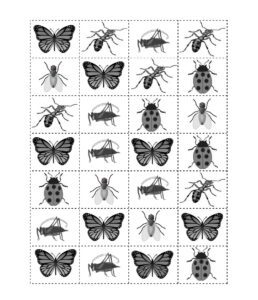
Issue a set of the Organizing Insects cards to each pair. Have students cut the insects cards apart. Give each student an Organizing Insects sheet. Instruct pairs to organize the insects and write tally marks in the frequency table to show how many of each kind of insect. Then have them construct a line plot to display the insect data. Have students answer the questions on the sheet. Review students answers in a class discussion.
Make Teaching Easier and Fun With CCMath Activities!